Geiger Gibson / RCHN Community Health Foundation Research Collaborative
Policy Issue Brief #66
October 2021
Jessica Sharac, PhD, MSc, MPH
Feygele Jacobs, DrPH, MS, MPH
Peter Shin, PhD, MPH
Sara Rosenbaum, JD
- Executive Summary
-
In thousands of medically underserved rural and urban communities, community health centers played a vital role in the first year of the COVID-19 pandemic. With crucial financial support through supplemental grants and Medicaid, health centers tested more than 3.7 million patients for the novel coronavirus and cared for nearly 745,000 patients with COVID-19, while also demonstrating their ability to rapidly adapt to pandemic operating conditions. Though fewer than half of all health centers offered telemedicine services in 2019, nearly all did so in 2020. Virtual visits accounted for 25 percent of all community health center visits in 2020 compared to 0.4 percent in 2019. The latest evidence from the federal government also shows the pandemic’s clear impact on community health center services. The total number of patients served dropped by 1.2 million, with the number of children and adolescents served falling by 14 percent. Total visits fell by 8.6 million from 2019 to 2020 – a seven percent decrease. These declines translated into a drop in the number of patients receiving preventive care and diagnostic tests during 2020.
Rebuilding health center capacity – crucial for communities facing high poverty, elevated health risks, and extensive health disparities and a shortage of primary health care – will take both additional direct grant funding as well as sustained Medicaid investment. Pending federal legislation would provide a pathway to comprehensive, affordable health insurance among residents in the 12 states that have refused to adopt the Affordable Care Act’s (ACA) Medicaid expansion. In addition, in the coming months health centers may face the additional challenges that will arise if the federal government ends the special COVID-19 public health emergency declaration and, along with it, the continuous Medicaid enrollment protection that has been in place since March 2020.
Community Health Centers: A National Snapshot 2020

- Introduction
-
The year 2020 marked the start of the COVID-19 pandemic in the U.S., affecting every aspect of the health care delivery system. Community health centers are the largest source of primary health care in the U.S. Each year, community health centers report data on their patients, services, revenues, and staffing, among other measures, to the Health Resources and Services Administration (HRSA) through the Uniform Data System (UDS). In this policy issue brief, we report findings from the UDS for 2020, the first year of the COVID-19 pandemic in the U.S., and in comparison to UDS data from 2019 and to trend data from earlier years, which allows for an analysis of how the pandemic has affected health centers, the services they provide, and the patients they serve.
In 2020, 1,375 federally funded community health centers served 29 million patients,[1] or one in 11 U.S. residents, including one in five uninsured individuals and one in five rural residents.[2] During 2020, patient visits at federally-funded community health centers surpassed 114 million across 13,555 urban and rural locations. An additional 87 “look-alike” health centers, which meet all community health center requirements but do not receive federal health center grant funding, provided 2.8 million visits to just over 679,000 patients across 312 sites.[3]
- Main Report
-
Health centers are an important source of care for low-income people and communities of color
Community health centers play an outsize role in providing care to people of color; more than six in ten (62 percent) health center patients are members of racial/ethnic minority groups (Figure 1). In 2020, health centers served one in eight non-Hispanic Black Americans, and one in six Hispanic residents.[4] In 2020, about 975,000 health center patients were Asian, while approximately 248,000 were Native Hawaiian/Other Pacific Islander patients and 351,000 were American Indian/Alaska Native.[5] Health centers served nearly 465,000 residents of eight U.S. territories and Compact of Freely Associated states that year.[6]
Health center patients are overwhelmingly low-income; in 2020, more than two-thirds had family incomes at or below 100 percent of the federal poverty level ($21,720 for a family of three that year)[7] and 9 in 10 had family incomes at or below twice poverty. Health centers cared for one-third of people living in poverty in 2020.[1]
Women accounted for more than half (58 percent) of all health center patients in 2020, and women of reproductive age (15-44) accounted for one in four health center patients (26 percent) that year. Health centers served approximately one in three low-income women of reproductive age in the U.S.[2]
Figure 1
The number of child and adolescent health center patients fell by 14 percent from 2019 to 2020
Children represent more than one quarter of all health center patients, although, as discussed below, the proportion of health center patients who are children fell notably between 2019 and 2020, from 31 percent to 28 percent,[3] mirroring a nationwide trend of declining pediatric care during the pandemic as families tried to avoid exposure to possible infection by delaying or forgoing health care for children.[4]
Figure 2 illustrates the change in the volume of total patients and patients by age group between 2019 and 2020. The total number of patients served fell by over 1.2 million, or four percent. This was the first recorded drop in the number of health center patients since the UDS was established over 25 years ago.[5] The number of children served fell by over 1.3 million, or 14 percent, the largest decline among the age groups. This decline may be partially attributable to temporary closures of school-based sites—nearly 2,100 health center sites were temporarily closed as of April 2020[6] and school-based sites accounted for more than 3,000 (22 percent) of all 13,555 health center sites in 2020[7]—but it is difficult to say with certainty because HRSA’s Health Center COVID-19 Survey has tracked the number but not the type of temporarily closed sites.[8]
Figure 2
In contrast to younger patients, the number of non-elderly adult patients remained stable from 2019 to 2020, while the number of elderly patients grew by two percent. The share of non-elderly adult patients age 18 to 64 grew from 60 percent to 62 percent during that same time period, while the share of elderly patients remained stable at ten percent. Over time, the percentage of adult health center patients ages 65 and older has slowly climbed, from seven percent in 2002 to 10 percent in 2020;[1] over that same time period, the share of children declined from 36 percent to 28 percent and non-elderly adult patients increased from 57 percent to 62 percent (Figure 3). The increasing percentage of health center patients who are elderly likely reflects a number of factors, including the growing number of poor elderly adults,[2]a general aging of the population and changes in health care seeking patterns,[3] and the importance of health centers as a source of ambulatory care for dual-eligible patients.[4]
Figure 3
The number and proportion of Medicaid and uninsured patients decreased between 2019 and 2020
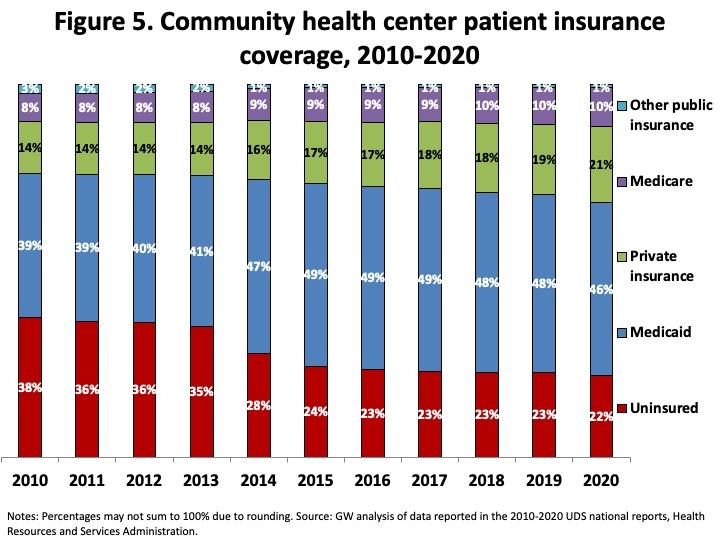
There were also changes in the insurance mix of patients. As Figure 4 shows, after 19 years of steady growth, the number of Medicaid patients fell between 2019 and 2020. Medicaid patients fell by just under a million between 2019 and 2020, or seven percent, while the number of uninsured patients declined by half a million, or eight percent. Although the reasons for the decline among the Medicaid and uninsured patient population are unclear, the pandemic likely exacerbated general access barriers including lack of public transportation, reduced wages or working hours, and heightened the need for addressing other competing priorities such as food and housing.[5] The number of patients with private insurance coverage or with access to employer-based coverage increased by nearly 229,000 patients, or four percent, and consistent with the growth in elderly patients, Medicare patients also increased by two percent during that time period. Figure 5 illustrates the changes in patients’ insurance coverage over the last decade. In 2020, Medicaid patients accounted for nearly half (46 percent) of patients, while more than one in five (22 percent) were uninsured or privately insured (21 percent), compared to 48 percent, 23 percent, and 19 percent, respectively, in 2019. The share of patients with Medicare (ten percent) and other public insurance (one percent) remained stable in both years.
Figure 4
Figure 5
Health centers rapidly expanded their provision of telemedicine but total visits remained below 2019 levels
Table 1 shows how health centers’ operational capacity changed from 2019 to 2020. There was modest growth in staffing, as measured by full-time equivalent staff members, as well as in the number of health center sites. Total visits dropped by nearly 8.6 million, or seven percent, with a much greater decline in clinic visits, which fell by 36.6 million, or 30 percent. HRSA has tracked the effect of the COVID-19 pandemic on health centers’ visit volume since the early months of the pandemic through its Health Center COVID-19 Survey.[6] The decline in health center visits compared to pre-pandemic visit volume peaked at 53 percent in April 2020. While visits increased throughout the remainder of the year and one year later[7] stood at 13 percent below pre-pandemic levels, visits were still down by seven percent as of September 24, 2021,[8] more than a year and a half after the World Health Organization declared COVID-19 a pandemic,[9] indicating that the recovery in activity remains incomplete.
Community health centers responded to the pandemic by rapidly adopting virtual visits, with the help of greater reimbursement flexibility for telehealth services.[10] While less than half (43 percent) of community health centers reported telemedicine use in 2019, nearly all (99 percent) did in 2020.[11] The number of virtual visits grew from less than 480,000 in 2019 to more than 28.5 million in 2020, a nearly 6,000 percent increase (Table 1). Accordingly, in 2020, telehealth visits accounted for 25 percent of all visits compared to 0.4 percent in 2019 (Figure 6). In April 2020, telehealth use peaked with more than half (54 percent) of weekly visits conducted virtually, on average;[12] this share fell to 24 percent by April 2021 and as of September 2021, telehealth visits accounted for 19 percent of visits, on average.[13]
Table 1
2019 2020 Number Change Percentage Change Title XX XX XX XX Title XX XX XX XX Title XX XX XX XX Title XX XX XX XX Title XX XX XX XX Title XX XX XX XX Figure 6

2019
2020
Unlike other service types, the number of mental health services visits increased during the pandemic
Table 2 provides more detail on the change in visit volume by service type. Across most services, the number of visits declined between 2019 to 2020. The greatest declines can be seen for those services most difficult to adapt to virtual care, i.e., dental and vision care, at 34 percent and 28 percent, respectively. In contrast to other service types, and likely due to increasing mental health needs during the pandemic[14] as well as the ability of telehealth services to increase access to mental health care,[15] visits for mental health services increased by 15 percent from 2019 to 2020. Mental health services were also the only service type for which more visits were provided virtually than in-clinic in 2020 (Table 2). Mental health visits accounted for more than a quarter (26 percent) of virtual visits and 12 percent of all visits in 2020 (Figure 7).
Table 2
2019 2020 Number Change Percentage Change Title XX XX XX XX Title XX XX XX XX Title XX XX XX XX Title XX XX XX XX Title XX XX XX XX Title XX XX XX XX Figure 7
Clinic Visits
Virtual Visits
Total Visits
In the face of research indicating that the COVID-19 pandemic has increased substance use disorders and drug overdose deaths,[16] visits for substance use disorder (SUD) services fell by more than 164,000 visits, or nine percent, from 2019 to 2020 (Table 2). This finding mirrors national trends as there was a 13 percent decline in SUD services for non-elderly adult Medicaid and Children’s Health Insurance Program (CHIP) beneficiaries from March to October 2020 compared to the same time period in 2019.[17]
Between 2019 and 2020, the number of SUD patients served by community health centers declined by ten percent, from approximately 326,000 to 295,000. although the number of patients receiving medication-assisted treatment (MAT) for opioid use disorder grew by 27 percent, from approximately 143,000 patients in 2019 to 182,000 patients in 2020. Nearly all (97 percent) community health centers offered mental health counseling and treatment services and 77 percent offered SUD services in 2020.[18]
Health centers are actively engaged in COVID-19 testing and vaccinations
Health centers were essential health care responders in the first year of the COVID-19 pandemic. They provided care to approximately 745,000 patients diagnosed with COVID-19, including more than 70,400 patients who also were diagnosed with an acute respiratory illness caused by COVID-19 such as pneumonia or bronchitis.[19] During 2020, community health centers tested more than 3.7 million patients for the novel coronavirus infection and approximately 279,000 for antibodies to the virus (Figure 8). At the end of 2020, in the first few weeks that COVID-19 vaccines were administered, health centers reported that they vaccinated 72,704 health center patients.

Figure 8
Utilization of preventive health services and diagnostic tests declined in 2020
Overall use of care declined as patients limited their health care visits in response to social distancing requirements and federal recommendations to avoid “non-essential” care early in the pandemic,[20] and as health centers dealt with limited operational and staff capacity. In April 2020, at their worst reported levels, 16 percent of health center sites were closed and 16 percent of health center staff members were unable to work for reasons ranging from lacking personal protective equipment to being ill with COVID-19; over the year from April 2020 to April 2021, nearly 41,000 staff members had confirmed cases of the COVID-19 virus.[21]
As Table 3 shows, the number of health center patients who received preventive services or diagnostic tests decreased most substantially from 2019 to 2020 for eye exams, selected immunizations, Pap tests to screen for cervical cancer, and childhood lead test screenings. As service utilization and visits decreased from 2019 to 2020, health centers’ performance on certain clinical quality measures also declined.[22] While performance on childhood immunizations and early entry into prenatal care remained stable, performance on quality measures for cervical cancer screening, colorectal cancer screening, and dental sealants for children declined between 2019 and 2020 (Figure 9). Some of these findings are in line with national trends of decreased service utilization for children enrolled in Medicaid and CHIP; from March to October 2020, vaccinations for children under age two, child screening services, and dental services for children fell by nine percent, 21 percent, and 39 percent, respectively, compared to service utilization for that same period of time in 2019.[23]
Table 3
2019 2020 Number Change Percentage Change Title XX XX XX XX Title XX XX XX XX Title XX XX XX XX Title XX XX XX XX Title XX XX XX XX Title XX XX XX XX
Figure 9
Health centers begin to see an increase in financial resources particularly for their COVID-19 response
During 2020 and 2021, community health centers received several rounds of supplemental funding in order to address COVID-19 specific needs. Total health center revenue increased from $31.4 billion in 2019 to $34.5 billion in 2020. While the share of total revenue by source remained stable for most categories from 2019 to 2020 (Figure 10), the share of total revenue from Medicaid fell from 43 percent to 40 percent. This decrease is attributable to federal grants accounting for larger shares of total revenue in 2020, as Medicaid revenue remained stable at $13.6 billion in both years. Section 330 health center grant funding increased from $5 billion in 2019 to $6.1 billion in 2020, including $4.8 billion in regular grants and $1.3 billion in COVID-19 supplemental funding (under the Coronavirus Aid, Relief, and Economic Security Act). Accordingly, 330 grants increased from 16 percent of total revenue in 2019 to 18 percent in 2020. Other federal grants grew from two percent of total revenue in 2019 to four percent in 2020, the result in part of approximately $838 million from the Provider Relief Fund, which accounted for more than half (59 percent) of other federal grants in 2020. Health centers also received just under $50 million from COVID-19 Uninsured Programs in 2020, reported in other public insurance revenue.
Figure 10
2019
2020
Similar to the national picture, health centers in both Medicaid expansion and non-expansion states experienced declines in the share of revenue from Medicaid (Figure 11), although at the starting point in 2019, the share of Medicaid for non-expansion state health centers (28 percent) was much lower than for health centers in Medicaid expansion states (48 percent). Similarly in line with national changes, the share of total revenue from federal BPHC grants and from other federal grants increased from 2019 to 2020 for both groups. The infusion of new federal funds was likely critical to offsetting increased costs (total costs increased from $31.8 billion in 2019 to $33.8 billion in 2020)[24] and maintaining staffing.
Figure 11
Non-Expansion States 2019
Non-Expansion States 2020
Medicaid Expansion States 2019
Medicaid Expansion States 2020
- Conclusion
-
A comparison of health center data from 2020 and 2019 and earlier trend data show the clear effect of the COVID-19 pandemic on health centers, the volume of care provided, and the number patients. From 2019 to 2020, the number of total patients fell by four percent and the number of children served declined to a much greater degree, by 14 percent. While the rapid expansion of virtual visits helped to offset a 30 percent decline in in-clinic visits, health center visits fell by seven percent overall, with visits declining across most service types. Data from HRSA’s Health Center COVID-19 Survey reveal that health centers, like other providers, face a continuing challenge in their ability to recover to full operational capacity; as of September 2021, visit volume was down by seven percent compared to pre-pandemic visit volume, and 315 sites were temporarily closed as of mid-August 2021.[25] In order to meet pent-up demand for care delayed earlier in the pandemic as patients return to normal health care utilization patterns, community health centers will need to have the staffing and capacity to serve them. For example, as students return to in-person school, school-based health center sites that were temporarily closed will need to re-open to serve the children and adolescent patients who received fewer health services in 2020 to avoid long-term health consequences of their delayed or forgone care.
Still, despite unprecedented conditions, community health centers succeeded in testing millions for COVID-19 and treating three-quarters of a million patients diagnosed with COVID-19 illness. Health centers also increased their provision of mental health visits, and more patients received MAT services for opioid use disorder in 2020. That they were able to do so in the face of a historic pandemic reflects their role as essential providers for medically underserved communities, deep community roots, and the infusion of COVID-19 specific funding to both enable their COVID-19 response and to support their traditional provision of care.
However, substantial challenges remain. As trusted providers long embedded in their communities, community health centers have a history of reducing health disparities and increasing access to and providing high-quality care.[26] Despite this, 2020 UDS data report decreased performance on certain quality measures and reduced numbers of diagnostic screenings and preventive services, which could have longer-term health consequences for health center patients. Furthermore, with the Delta variant and uneven vaccination rates across the country causing a surge in COVID-19 cases, the COVID-19 pandemic is far from over, meaning that community health centers are facing the continued burden of providing COVID-19 diagnostic testing, vaccines, and booster shots[27] while scaling up their routine services.
Community health centers may face an additional, major challenge in the coming months that will further strain clinical and financial recovery. Continuous Medicaid enrollment during the pandemic emergency period and enhanced Medicaid funding[28] has likely prevented Medicaid revenue declines. When the public health emergency period ends, millions of patients whose coverage has remained stable over the past 18 months will need to undergo eligibility redeterminations, increasing the risk of coverage interruption. In some cases, actual changes in patients’ financial, household, or health status may lead to the loss of coverage. In other cases, the process of updating eligibility can cause enrollment lapses due to information being incomplete, or not provided in a sufficiently timely fashion. The need to intensively help patients navigate what can be a complex renewal and review process is likely to place added strains on health center outreach and eligibility assistance staff, a fact that underscores the importance of additional federal grant funding to assist health centers in meeting the need for additional staffing to help their patients with this process.
Finally, the situation facing community health centers serving patients in the 12 remaining Medicaid non-expansion states[29] disproportionately concentrated among the states with the highest COVID-19 caseloads[30] remains a national matter of great concern. People falling into the coverage gap in these states – ineligible for Medicaid but too poor for Marketplace subsidies – are disproportionately Black and Latino,[31] making the coverage gap a major source of health inequity and a seriously limiting factor in health centers’ financial capacity to meet community need. Legislation now pending in Congress would close this gap through a combination of near-term highly subsidized plans, followed by a permanent federal Medicaid program serving eligible people in non-expansion states. Should this legislation become law, its coverage and care impact on residents of non-expansion states merits close monitoring.
- Footnotes
-
[1] The UDS revised reporting of age categories up to age 19 in 2002.
[2] Li, Z., & Dalaker, J. (2019). Poverty among Americans aged 65 and older. Washington, DC: Congressional Research Service. https://sgp.fas.org/crs/misc/R45791.pdf
[3] Fulmer, T., Reuben, D. B., Auerbach, J., Fick, D. M., Galambos, C., & Johnson, K. S. (2021). Actualizing Better Health and Health Care for Older Adults: Commentary describes six vital directions to improve the care and quality of life for all older Americans. Health Affairs, 40(2), 219-225. https://www.healthaffairs.org/doi/10.1377/hlthaff.2020.01470
[4] National Association of Community Health Centers. (2021). Community Health Center Chartbook: Figure 1-7. https://www.nachc.org/wp-content/uploads/2021/04/Chartbook-Final-2021.pdf
[5] Karpman, M., Zuckerman, S., Gonzalez, D., & Kenney, G. M. (2020). The COVID-19 pandemic is straining families’ abilities to afford basic needs. The Urban Institute. https://www.urban.org/sites/default/files/publication/102124/the-covid-19-pandemic-is-straining-families-abilities-to-afford-basic-needs_5.pdf
[6] Bureau of Primary Health Care. (2020-2021). Health Center COVID-19 Survey. https://bphc.hrsa.gov/emergency-response/coronavirus-health-center-data
[7] Sharac, J., Morris, R., Casoni, M., Jacobs, F., & Shin, P. (2021). Community Health Centers’ Accomplishments and Challenges, One Year in to the COVID-19 Pandemic. Geiger Gibson/RCHN Community Health Foundation Research Collaborative, George Washington University. Policy Research Brief No. 65. https://www.rchnfoundation.org/?p=9685
[8] Bureau of Primary Health Care. (2021). Health Center COVID-19 Survey. https://bphc.hrsa.gov/emergency-response/coronavirus-health-center-data
[9] World Health Organization. (March 11, 2020). WHO Director-General's opening remarks at the media briefing on COVID-19 - 11 March 2020. https://www.who.int/director-general/speeches/detail/who-director-general-s-opening-remarks-at-the-media-briefing-on-covid-19---11-march-2020
[10] Morris, R., Hernandez, J., Rosenbaum, S., Jacobs, F., Shin, P., & Sharac, J. (2020). What can we learn from telehealth experience of community health centers during the COVID-19 pandemic? GW Health Policy & Management Matters Data Note. http://gwhpmmatters.com/what-can-we-learn-telehealth-experience-community-health-centers-during-covid-19-pandemic
[11] Health Resources and Services Administration. (2020). 2019 Health Center Data: National Data. https://data.hrsa.gov/tools/data-reporting/program-data/national/table?tableName=Full&year=2019; Health Resources and Services Administration. (2021). 2020 Health Center Data: National Data. https://data.hrsa.gov/tools/data-reporting/program-data/national/table?tableName=Full&year=2020
[12] Sharac, J., Morris, R., Casoni, M., Jacobs, F., & Shin, P. (2021). Community Health Centers’ Accomplishments and Challenges, One Year in to the COVID-19 Pandemic. Geiger Gibson/RCHN Community Health Foundation Research Collaborative, George Washington University. Policy Research Brief No. 65. https://www.rchnfoundation.org/?p=9685
[13] Bureau of Primary Health Care. (2021). Health Center COVID-19 Survey. https://bphc.hrsa.gov/emergency-response/coronavirus-health-center-data
[14] Vahratian, A., Blumberg, S. J., Terlizzi, E. P., & Schiller, J. S. (2021). Symptoms of anxiety or depressive disorder and use of mental health care among adults during the COVID-19 pandemic—United States, August 2020–February 2021. Morbidity and Mortality Weekly Report, 70(13), 490. https://www.cdc.gov/mmwr/volumes/70/wr/mm7013e2.htm
[15] Corallo, B., Tolbert, J., Rosenbaum, S. Sharac, J., Shin, P., & Trivedi, C. (2020). Community health centers’ role in delivering care to the nation’s underserved populations during the coronavirus pandemic. Kaiser Family Foundation. https://www.kff.org/coronavirus-covid-19/issue-brief/community-health-centers-role-in-delivering-care-to-the-nations-underserved-populations-during-the-coronavirus-pandemic/
[16] Panchal, N., Garfield, R., Cox, C., & Artiga, S. (2021). Substance Use Issues Are Worsening Alongside Access to Care. The Kaiser Family Foundation. https://www.kff.org/policy-watch/substance-use-issues-are-worsening-alongside-access-to-care/
[17] Centers for Medicare & Medicaid Services (CMS). (2021). Medicaid & CHIP and the COVID-19 Public Health
Emergency. Preliminary Medicaid & CHIP Data Snapshot: Services through October 31, 2020. https://www.medicaid.gov/state-resource-center/downloads/covid-19-medicaid-data-snapshot.pdf
[18] HRSA. (August 2021). Health Center Program: Impact and Growth. https://bphc.hrsa.gov/about/healthcenterprogram/index.html
[19] Health centers were instructed to report patients with diagnoses of COVID-19 and additional illnesses due to COVID-19 under both categories. “Documentation in the medical record and reporting of all diagnoses (not just primary diagnosis) and services rendered during the visit are required, if applicable. For example, if a patient has pneumonia and confirmed due to coronavirus (SARS-CoV-2) disease, assign and report codes U07.1 (coronavirus disease) on line 4c and J12.89 (other viral pneumonia) on line 6a” (p. 146). Bureau of Primary Health Care. (August 2020). Uniform Data System Reporting Instructions for 2020 Health Center Data. HRSA. https://bphc.hrsa.gov/sites/default/files/bphc/datareporting/pdf/2020-uds-manual.pdf
[20] CMS.gov. (March 18, 2020). CMS Releases Recommendations on Adult Elective Surgeries, Non-Essential Medical, Surgical, and Dental Procedures during COVID-19 Response. https://www.cms.gov/newsroom/press-releases/cms-releases-recommendations-adult-elective-surgeries-non-essential-medical-surgical-and-dental
[21] Sharac, J., Morris, R., Casoni, M., Jacobs, F., & Shin, P. (2021). Community Health Centers’ Accomplishments and Challenges, One Year in to the COVID-19 Pandemic. Geiger Gibson/RCHN Community Health Foundation Research Collaborative, George Washington University. Policy Research Brief No. 65. https://www.rchnfoundation.org/?p=9685
[22] The quality measures did not change between 2019 and 2020 except for the colorectal cancer screening, which was revised to add two exclusions, and the childhood immunization measure, which added the 4-dose HiB vaccine. https://bphc.hrsa.gov/sites/default/files/bphc/datareporting/reporting/2020-clinical-measures-handout.pdf
[23] Centers for Medicare & Medicaid Services (CMS). (2021). Medicaid & CHIP and the COVID-19 Public Health
Emergency. Preliminary Medicaid & CHIP Data Snapshot: Services through October 31, 2020. https://www.medicaid.gov/state-resource-center/downloads/covid-19-medicaid-data-snapshot.pdf
[24] Health Resources and Services Administration. (2020). 2019 Health Center Data: National Data. https://data.hrsa.gov/tools/data-reporting/program-data/national/table?tableName=Full&year=2019; Health Resources and Services Administration. (2021). 2020 Health Center Data: National Data. https://data.hrsa.gov/tools/data-reporting/program-data/national/table?tableName=Full&year=2020
[25] Bureau of Primary Health Care. (2020-2021). Health Center COVID-19 Survey. https://bphc.hrsa.gov/emergency-response/coronavirus-health-center-data. Note that the survey for the time period ending August 13, 2021 was the last one to ask health centers to report the number of temporarily closed sites.
[26] National Association of Community Health Centers. (2017). Studies on Health Centers Improving Access to Care. https://nachc.org/wp-content/uploads/2017/06/Access_June-2017.pdf ; National Association of Community Health Centers. (2017). Studies of Health Center Quality of Care. https://nachc.org/wp-content/uploads/2017/06/Quality_June-2017.pdf
[27] Health centers reported 17,664 patients who received additional COVID-19 vaccine doses for the two-week period ending September 10, 2021. Bureau of Primary Health Care. (2021). Health Center COVID-19 Survey. https://bphc.hrsa.gov/emergency-response/coronavirus-health-center-data.
[28] Rosenbaum, S., Handley, M., & Morris, R. (January 2021). Winding Down Continuous Enrollment for Medicaid Beneficiaries When the Public Health Emergency Ends. The Commonwealth Fund. https://www.commonwealthfund.org/publications/issue-briefs/2021/jan/winding-down-enrollment-medicaid-health-emergency-ends
[29] Kaiser Family Foundation. (September 2021). Status of State Medicaid Expansion Decisions: Interactive Map. https://www.kff.org/medicaid/issue-brief/status-of-state-medicaid-expansion-decisions-interactive-map/
[30] Hussein, M. R., Morsi, I., Awad, E. A., Fayed, D. A., AlSulaiman, T., Habib, M., & Herbold, J. R. (2021). The differential impact of the COVID-19 epidemic on Medicaid expansion and non-expansion states. medRxiv. https://www.medrxiv.org/content/10.1101/2021.02.23.21252296v1.full
[31] Lukens, G., & Sharer, B. (June 2021). Closing Medicaid Coverage Gap Would Help Diverse Group and Narrow Racial Disparities. Center on Budget and Policy Priorities. https://www.cbpp.org/research/health/closing-medicaid-coverage-gap-would-help-diverse-group-and-narrow-racial